PREVALENCE OF HIV/AIDS AMONG INTENDING DONORS
ABSTRACT
The Human Immune deficiency Virus(HIV) and the Acquired Immune Deficiency Syndrome (AIDS) situation in Nigeria have affected blood collection in the country leading to a decline from 150,000 units to about 70,000 units annually, yet the demand for blood in Nigeria exceeds 300,000 units per year.
Schools are major sources of blood in all counties of Nigeria and more than 60% of blood in Nigeria is collected from secondary school students but the data on HIV prevalence in this category of donors is scarce. The objective of this study was to determine the prevalence of HIV among intending blood donors in Lagos State and to determine their knowledge of blood donation and blood transfusion practices.
Four hundred and thirty-four (434) students intending blood donors were screened for anti-HIV antibodies… (Scroll down for the link to get the Complete Chapter One to Five Project Material)

INTRODUCTION
Laboratory testing to identify HIV infection has been used throughout the world for over 20 years and continues to be a major intervention in protecting recipients of blood and tissues (Constantine et al., 2005). Serological screening of donor blood for HIV antibodies remains a critical component in identifying and eliminating HIV infected blood donations (Nkengasong et al., 1999) but, this test rarely detects HIV antigen-positive blood donors who are in the window period.
Detection of this early viraemic stage continues to be a challenge in transfusion medicine worldwide because of the possibility of transmitting HIV infection (Polywka et al., 2005). Many countries employ stringent blood donor selection criteria to defer potentially infectious donors with a high risk of HIV infection and employ highly sensitive screening methods like Nucleic Acid Amplification Testing (NAAT) in a nationally coordinated Blood Transfusion Service.
Following this approach, developed countries like the United States of America (USA), United Kingdom (UK)… (Scroll down for the link to get the Complete Chapter One to Five Project Material)
Problem Statement
Detection of the early viraemic stage of HIV continues to be a challenge in transfusion medicine worldwide because of the possibility of transmitting HIV infection. Serological screening of donor blood for HIV antibodies remains a critical component of identifying and eliminating HIV infected blood… (Scroll down for the link to get the Complete Chapter One to Five Project Material)
Research Objectives
The major objective of the study is the prevalence of HIV/AIDS among intending donors.

LITERATURE REVIEW
Definition of blood
Blood refers to the fluid that circulates through the body’s vascular system comprising of the heart, arteries, capillaries, and veins and is the chief means of transport within the body. It transports oxygen from the lungs to the body tissues, carbon dioxide from the tissues to the lungs, nutritive substances and metabolites to the tissues It also removes waste products to the kidneys and other organs for excretion.
Blood has an essential role in the maintenance of fluid balance. In cases of injuries, blood cells and antibodies in the blood move to the point of infection to fight the invading pathogens… (Scroll down for the link to get the Complete Chapter One to Five Project Material)
Importance of blood
Blood is the most precious fluid in the human body and incomparable to anything else. In spite of the rapid and remarkable progress of medical science today, there has been little success in producing anything equivalent to blood and its various components.
For those who require blood for any reason including emergencies resulting from accidents or other conditions leading to blood loss, blood donation remains the only mechanism… (Scroll down for the link to get the Complete Chapter One to Five Project Material)
Global Blood Supply
More than half of all blood donations globally are collected in the high- income countries, which only carry 18 % of the world’s population (Mulugeta et al., 2016). There is a remarkable difference in blood use between high-income countries and low-income countries.
More than 65 % of blood donated in low-income countries finds a use for transfusing children under five years, yet more than 70% of donated blood in high- income countries is used in patients aged over 65 years… (Scroll down for the link to get the Complete Chapter One to Five Project Material)
Blood demand and supply in Nigeria
The demand for blood in Nigeria is between 200,000 and 300, 000 units per year. However, with World Health Organizations’ guidelines of 10-20 units per 1,000 people, then the need should range between 380,000 – 760,000 units annually. Currently, only 125,000 units of blood are collected through the National Blood Transfusion Service (NBTS).
Family replacement donors cover the blood supply deficit (Michelle et al., 2016). In Nigeria, family replacement donors according to studies only account for 35 % of donors. A further complication for the blood supply situation in Nigeria arises from the fact that over 70 % of intending blood donors are the first time… (Scroll down for the link to get the Complete Chapter One to Five Project Material)
Blood Transfusion risks and complications of blood donation
Blood transfusions carry several risks including the possible transmission of the Human immune-deficiency Virus (Shimian et al., 2012). Blood transfusion is the third most important mode of HIV transmission in Sub-Saharan Africa (Aleruchi et al, 2014).
The population most affected by transfusion-induced infection in children aged below five years mainly suffering from malaria. Blood transfusion in Sub-Saharan Africa apart from HIV transmission carries a high risk of other blood transmissible infections like HBV, HCV, Syphilis, and malaria (WHO, 2014)… (Scroll down for the link to get the Complete Chapter One to Five Project Material)
HIV prevalence among intending blood donors in Nigeria
Population-based surveys undertaken in the last 10 years show that HIV prevalence among women and men aged 15-49 years ranged from 6.2% in 2003 to 5.6% in 2012. (Sirengo et al., 2016).
A study in Trans Nzoia District between 2001, 2002, and 2003 found the prevalence of HIV among donors to be 3.8% and concluded that the prevalence of HIV among donors would be higher if a larger sample population was used (MOH, 2005). In Nigeria, the most frequent source of blood is donations from relatives or friends to replace the blood… (Scroll down for the link to get the Complete Chapter One to Five Project Material)
HIV prevalence among youth in Nigeria
Adolescents and young people represent a sizeable share of people living with HIV globally. An estimated 35 million people were living with HIV by the end of 2012 and of these 2.1 million were adolescents.
The majority of those living with HIV were located in Sub-Saharan Africa (UNAIDS, 2014). Data from the United Nations Children’s Fund (UNICEF) show that in 2016 alone, 610,000 young people between the ages of 15-24 years were new infections with HIV… (Scroll down for the link to get the Complete Chapter One to Five Project Material)
RESEARCH METHODOLOGY
Study Population
The study population comprised students intending blood donors in secondary schools within Lagos. All students aged 16 years and above as required by the NBTS guidelines (Appendix 2) in these schools were targeted.
Inclusion Criteria
- Students aged 16 years and above (Appendix 2)
- Students weighing 50 Kgs and above
- Students with Hemoglobin levels of 12.5 g/dl and above
- Students who assented to be included in the study and filled the respondents’ questionnaire (Appendix 8)
Exclusion Criteria
- All students aged below 16 years
- All students whose weight is below 50Kg
- All students reporting minor illnesses
- All students with Hb levels below 12.5 g/dl
- All students who did not consent to be included in the
Sampling Methods
Stratification and simple random sampling were used to get the required samples. Secondary schools in Lagos state (Appendix 7) were grouped into the following strata; Two (2) all girls-only schools (1 boarding 1 day), Two (2) All boys-only schools (1 boarding 1 day) and Two (2) Mixed-gender schools (1 boarding 1 day). Simple random sampling was then used to pick a proportionate number of donors from each school until the desired sample size was attained.
Blood Sample Collection
Each donor in all the schools visited was interviewed and filled blood donor questionnaires (Appendix 3) in line with NBTS guidelines (Appendix 2). Vital signs were taken for each potential donor and they all underwent a physical examination before blood samples were collected. Hemoglobin levels were estimated for each donor using the copper sulfate gravity method for Hb estimation according to the NBTS’ SOP003 of 2014 (Appendix 4)… (Scroll down for the link to get the Complete Chapter One to Five Project Material)
Data Analysis
Data collected from the study were coded and entered into a computer excel sheet. Data verification and validation were performed by rechecking all data entries with the original data forms to achieve a clean data set that was then exported into SPSS version 22 for analysis. Pearson’s Chi-square test was used to test the strength of association between variables… (Scroll down for the link to get the Complete Chapter One to Five Project Material)
RESEARCH FINDINGS AND DISCUSSION
- Demographic characteristics of students
Four hundred and thirty-four (434) students intending blood donors comprising 248 (57.14 %) males and 186 (42.86 %) females enrolled in this study. Their ages ranged between 16–28 years with a mean age of 17.25 ±1.057 years. The mean ages were 18 ± 1.433 while the ages of the females were 17 ± 1.057 years. The majority (33.9 %, n = 434) of the donors were 16 years old, followed by those aged 17 years (28.6 %, n=434). Students aged 19 years and above were fewest at (14.3 %, n = 434).
Table 4.1: Demographic characteristics of the study population
| Demographic | Number of students (n =
434) |
Percent |
| Gender | ||
| Male | 248 | 57.14 |
| Female | 186 | 42.86 |
| Age (Years) | ||
| 16 years | 147 | 33.87 |
| 17 years | 124 | 28.57 |
| 18 years | 101 | 23.27 |
| 19 + years | 62 | 14.3 |
Table 4.1 above gives a summary of the age distribution of the study participants. Those aged 16 were 147 in number representing 33.9 % of all the study participants suggesting more donations come from the younger category of donors in secondary schools. Those aged 19 and above only constituted 14 % (62), 17- year- olds were 124 (29 %) and those aged 18 years were 101(23 %)
Table 4.2: Study population and actual sample size
| School category | Population | %Total population | Calculated Proportionate stratum
sample size |
Actual number of samples collected |
| All Girls Boarding | 550 | 14.6 | 56 | 95 |
| All Girls Day | 415 | 11.0 | 42 | 44 |
| All Boys Boarding | 900 | 23.9 | 92 | 93 |
| All Boys Day | 970 | 25.8 | 99 | 101 |
| Mixed Gender Day | 360 | 9.6 | 37 | 41 |
| Mixed Gender Boarding | 570 | 15.1 | 58 | 60 |
| Total | 3765 | 100 | 384 | 434 |
Table 4.2 summarizes the composition of the study population. All girls boarding category had a population of 550 students representing 14.6 % of the total population. The all-girls day category of the school had 415 students accounting for 11 % of the total study population… (Scroll down for the link to get the Complete Chapter One to Five Project Material)
Age distribution by gender of the students
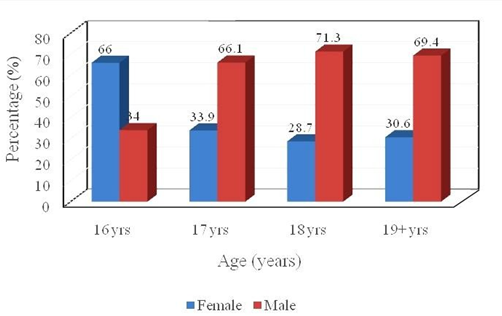
Considering the student’s gender, the age distribution by gender was established in this study as shown in figure 4.1 below. In the ages of 17 years (66.1 % males), 18 (71.3 % males), and 19 years (69.4 %), male students dominated the female students in the number of respondents received. However, at the age of 16 years, female students (66.0 %) were more than the male students (34.0 %) were.

Figure 4.1: Age Distribution of students by gender among the sampled population
(Scroll down for the link to get the Complete Chapter One to Five Project Material)
HIV prevalence among the students
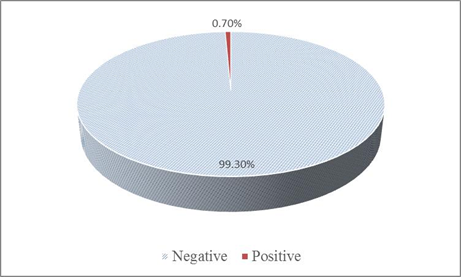
Three (3) donors tested positive for HIV antibodies representing the prevalence of 0.7 % (Figure 4.2). Of these, two (0.46 %) were boys and one (0.23 %) was a girl. The analysis of these numbers, with a 95% confidence limit, did not demonstrate a significant difference in prevalence between genders.

Figure 4.2: HIV Prevalence among the student intending blood donors
(Scroll down for the link to get the Complete Chapter One to Five Project Material)
HIV prevalence among the students by age
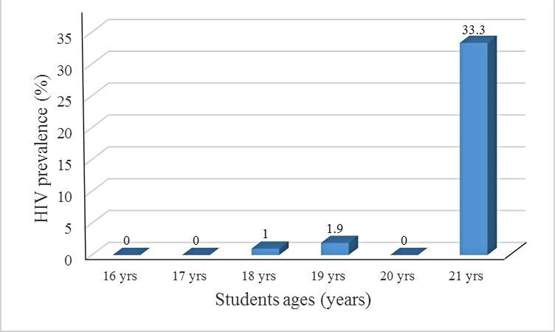
The three students found to be HIV-positive were aged 18, 19, and 21 years. HIV prevalence amongst students based on their age was therefore 1.0 %, 1.9 %, and 33.0 % respectively. Students aged 16 years and those aged 17 years had no cases of HIV.
In establishing a relationship between the students’ ages and the HIV status of the students, a Pearson correlation was conducted (r = 0.843, P = 0.073) (Figure 4.3). This showed that there was no significant correlation established between age and HIV status of the students (Appendix 11).

Figure 4.3: HIV Prevalence by age (years) in the sampled population
(Scroll down for the link to get the Complete Chapter One to Five Project Material)
CONCLUSION AND RECOMMENDATION
Conclusions
- From the results of the study, it can be concluded that the prevalence of HIV among intending blood donors is still low (0.7 %) compared to the general population (6.1 %). As such, this category of donors still constitutes a much safer population compared to other groups of
The results do not show any significant differences in the prevalence of HIV among students attending the different categories of schools suggesting that the category of the school had no effect on the HIV prevalence among the students… (Scroll down for the link to get the Complete Chapter One to Five Project Material)
Recommendations
Campaigns on recruitment of secondary school students as voluntary unremunerated intending blood donors require strengthening as a more cost-effective strategy. Strengthening efforts to recruit donors from only low-risk populations such as secondary schools is also recommended.. (Scroll down for the link to get the Complete Chapter One to Five Project Material)

REFERENCES
Adelbert, B. J., George, S., Christopher, D. H., and Beth, H. S. (2012). Blood donations motivators and barriers: A descriptive study of African American and white donors. Transfusion and Apheresis Science, 48: 87-93.
Agbovi, K. K., Malewe, Kolou., and Akuete, Y. Segbena (2006). Knowledge, attitudes, and practices about blood donation. A Sociological Study among the Population of Lomé in Togo. Transfusion Clinique et Biologique, 13: 260-5.
Aleruchi, O., Peterside, N. F., and Ezekoye, C.C (2014). Seroprevalence of HIV infection among intending blood donors at the University of Port Harcourt teaching hospital, Rivers state, Nigeria. Global Journal of Biology, Agriculture and Health Sciences, 3: 1-7.
Aisha, A., Munira, B., Nida, A., Imran, N., Rehan, A., Samson, B., Naveena, F., Mustansir, Z., and Tahir, S. (2016). Prevalence of transfusion transmissible infections in intending blood donors of Pakistan. BioMed Central Hematology, 10: 16-68.
American Red Cross Biomedical Services (ARCBS) (2012). FAQs about Donating Blood. Retrieved 2014-10-26 www.redcross.org/abou-us/media/subject- matter/experts/blood-services.
André, Loua., Janaki, Sonoo., Laurent, Musango., Jean, B. Nikiema., and Thomas Lapnet-Moustapha (2017). Blood Safety Status in WHO African Region Countries: Lessons Learnt from Mauritius. Journal of Blood Transfusion, 10: 1155-1163.
Barbara J, Bain., Imelda Bale., Michael, A. Laffan., and S, Mitchell Lewis. (2014). Dacie and Lewis Practical Haematology 11th edition Pg 118. ELSEVIER ISBN-13: 9780702034084. London, UK.
Bates, I., and Hassall, O. (2010). Should we neglect or nurture replacement intending blood donors in sub-Saharan Africa? Biologicals, 38: 65–7.
Blood link Foundation. (2016). Quick facts on blood and blood donation. Retrieved on 25-1-2016. www.bloodlinkfoundation.org/quik_facts.html.
Biomerieux. (2014). Vironostica HIV Uniform II ag/Ab 4th generation HIV sandwich ELISA product manual. The Netherlands.
Centers for Disease Control and Prevention. (2012). Progress Toward Strengthening National Blood Transfusion Services-14 Countries, 2008-2010. Journal of American Medical Association, 307: 138-141.
Centers for Disease Control and Prevention. (2013). Blood Safety basics.
Central Bureau of Statistics, Republic of Nigeria. (2009). Nigeria population census report.
(Scroll down for the link to get the Complete Chapter One to Five Project Material)
